How open are Americans to electoral system reform?
- November 21, 2023
New poll finds broad appetite for proportional representation

A new national poll conducted by Citizen Data on behalf of Protect Democracy confirms popular wisdom turned political trope — Americans are less than satisfied with their congressional representation. According to the poll, two-thirds wish they had more political parties to choose from. Less than half feel closely represented by their congressperson, and two-thirds don’t feel represented by Congress as a whole. These results hold true across the ideological spectrum — a majority of Republicans, Democrats, and Independents feel under-represented.
The familiarity of this dissatisfaction shouldn’t make it any less striking: in a functioning democracy, at least half of voters should feel represented overall, and most voters should at least feel represented by their individual congressperson.
The poll also reveals that Americans are quick to understand that the way we elect our representatives results in under-representation, and are therefore open to changing our electoral system.
Taken together, these findings suggest that dissatisfaction with representation is due in large part to the winner-take-all design of our electoral system, where a single winner is selected to represent an entire district. Those polled intuited what scholars have long argued: that winner-take-all can result in systematic underrepresentation — especially in diverse societies with significant racial and political minorities — along with uncompetitive elections that make much of the populace rightly feel like their vote doesn’t count.
It’s no wonder that most democracies around the world use some form of proportional representation instead, and that scholarly consensus recommends replacing winner-take-all with a more proportional system for U.S. elections, too.
Read more: Proportional representation, explained Read more: Proportional representation, explained
What do Americans think of proportional representation?
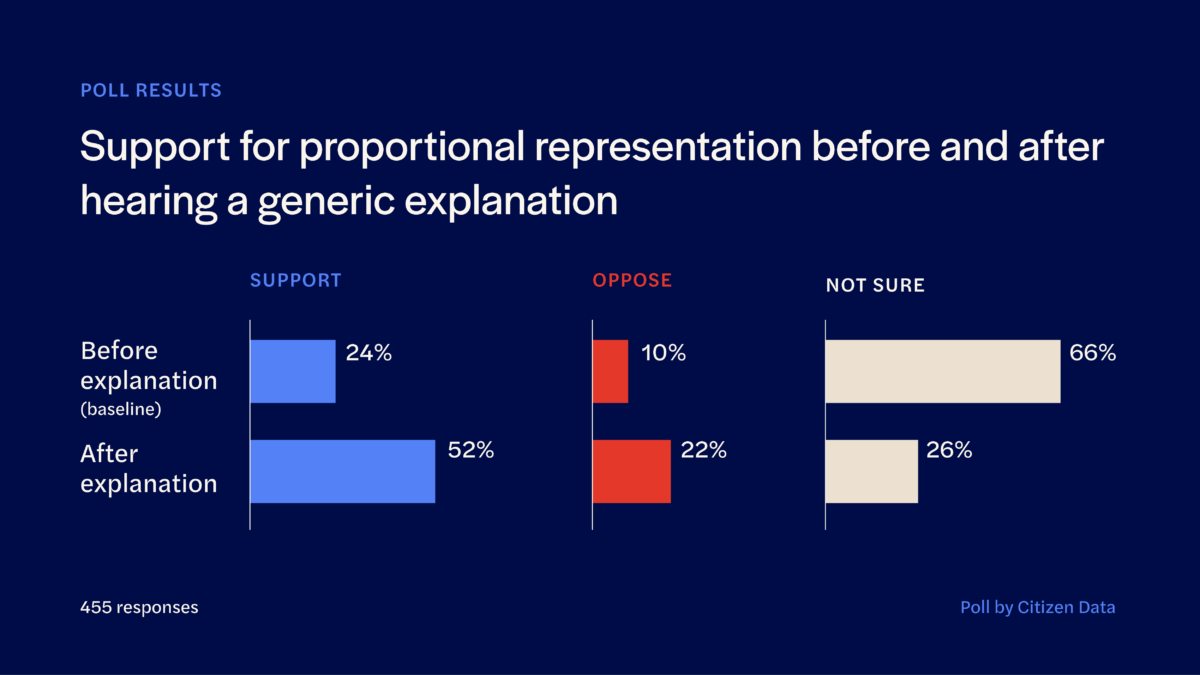
Though it’s true that American voters are unsatisfied with the outcomes of our current system, most (in this poll, 59%) have never even heard of proportional representation. To gauge potential support, Citizen Data explained proportional representation in two different ways to two different test groups.
Generic Test Group
In most US elections, we use a “winner-take-all” system. This means that the candidate who gets the most votes in a particular area becomes the representative of that area. For example, if three candidates are running for a single position and Candidate A gets 40% of the votes, Candidate B gets 35%, and Candidate C gets 25%, Candidate A would win, even though 60% of voters chose someone else.
In a proportional representation system, voters also choose between candidates, but multiple seats are up for grabs. The seats are divided based on the percentage of votes each candidate or party receives. For instance, in a 10-seat election, if a party gets 50% of the votes, it wins 5 seats. If another party gets 30% of the votes, it gets 3 seats, and so on. This way, the results better reflect the diverse preferences of the voters.
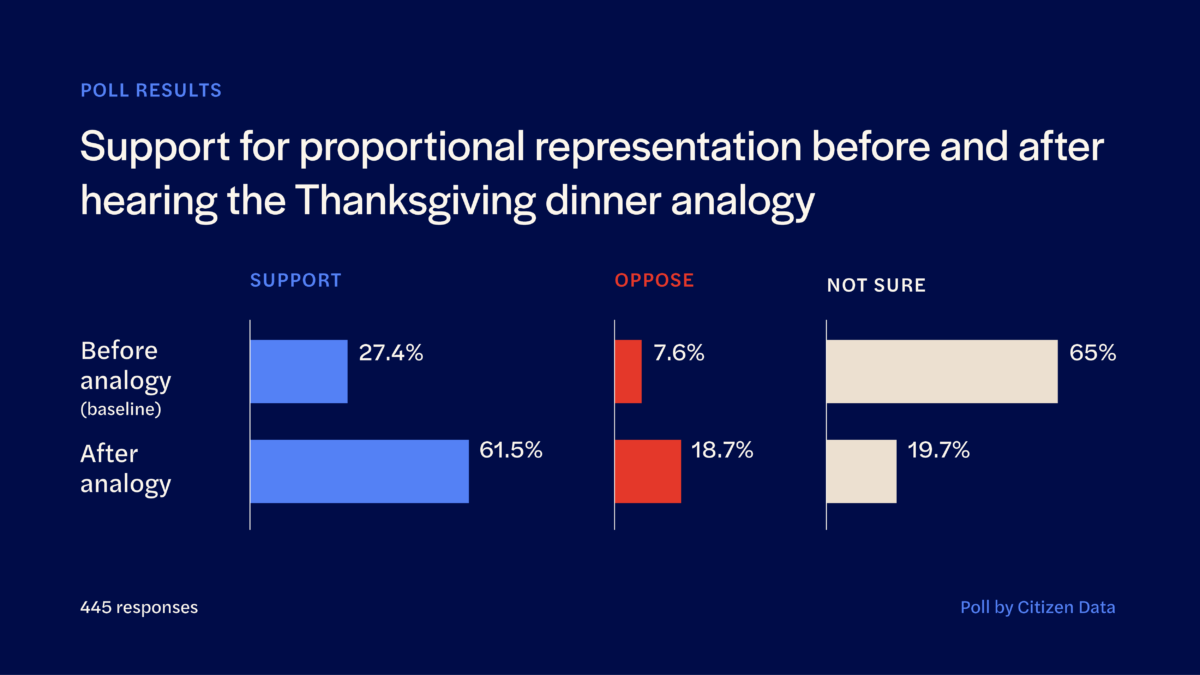
Thanksgiving Metaphor Test Group
In most US elections, we use a “winner-take-all” system. This means that the candidate who gets the most votes in a particular area becomes the representative of that area. Imagine we could only have one dish at Thanksgiving and everyone votes for their favorite. If mashed potatoes get the most votes, even if it’s just by a little, that’s the only dish we would have at dinner.
In a proportional representation system, voters also choose between candidates, but multiple seats are up for grabs. The seats are divided based on the percentage of votes each candidate or party receives. Imagine we can have ten dishes at our Thanksgiving table. Everyone votes, and the dishes with the most votes get a place on the table. If stuffing gets 50% of votes, it takes up 5 spots. If pumpkin pie gets 30% of the votes, it gets 3 spots. This way, more people’s favorite dishes get a chance to be on the Thanksgiving table, making the meal enjoyable for everyone!
It turns out that straightforward information about the nature of proportional representation reliably increased support for using it to elect representatives. In the group that received a generic explanation, support for proportional representation increased from 24% to 52%. The increase was even more significant in the group that received the Thanksgiving metaphor, where support climbed from 27.4% to 61.5%.
Why is the Thanksgiving metaphor so effective?
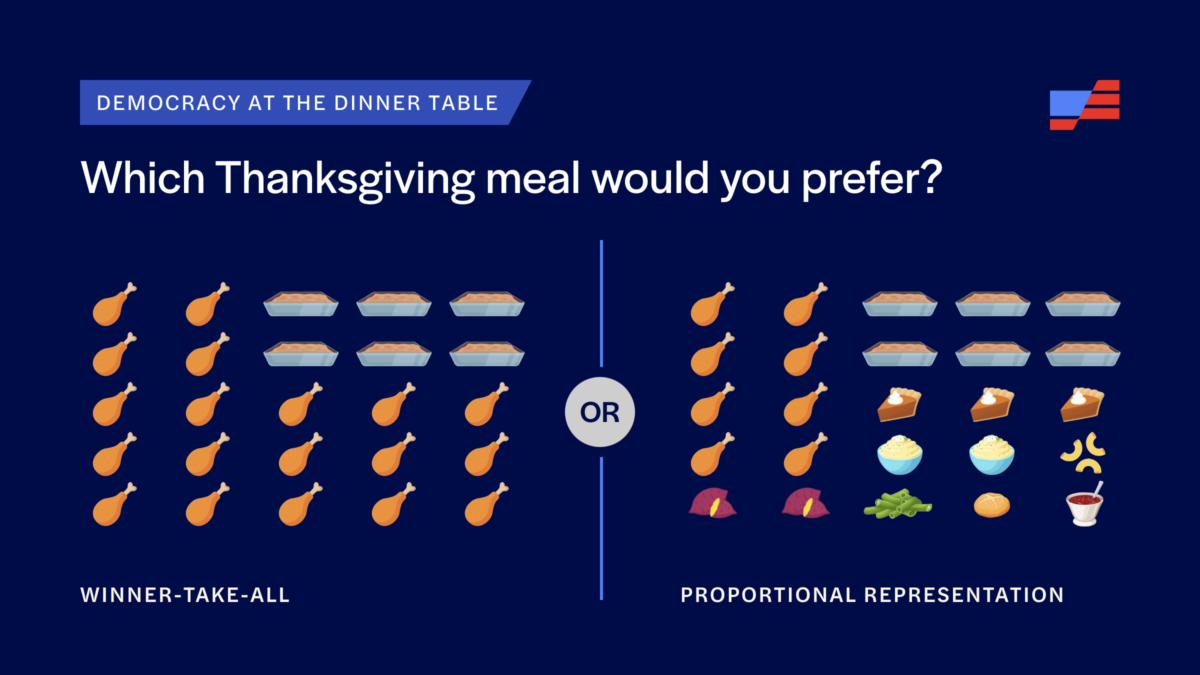
Protect Democracy has long used the Thanksgiving dinner metaphor to explain proportional representation — but this is the first time we actually put it to a national test. The poll asked voters to select their favorite Thanksgiving dish. To simulate a winner-take-all election, we split respondents into single-member-districts by census region and “elected” the most popular dish in each district. Every single district voted in favor of either turkey or stuffing — a perfect emulation of the confines of our two-party system.
In a second simulation, each district was allowed to elect any dish that reached a 5% threshold of support. This proportional representation round was undeniably more tasty — in addition to turkey and stuffing, favorites like pumpkin pie, mac and cheese, and mashed potatoes were added to the menu.
| Census Divisions | Winner-Take-All | Proportional Representation (5% threshold) |
| New England CT, ME, MA, NH, RI, VT | Turkey (44.7%) | Turkey, Stuffing, Pumpkin Pie, Green Bean Casserole |
| Middle Atlantic NJ, NY, PA | Turkey (37.9%) | Turkey, Stuffing, Pumpkin Pie, Macaroni and Cheese |
| East North Central IL, IN, MI, OH, WI | Turkey (29.8%) | Turkey, Stuffing, Pumpkin Pie, Mashed Potatoes, Sweet Potatoes |
| West North Central IA, KS, MN, MO, NE, ND, SD | Turkey (37%) | Turkey, Stuffing, Pumpkin Pie, Green Bean Casserole, Sweet Potatoes, Rolls/Biscuits |
| South Atlantic DE, FL, GA, MD, NC, SC, VA, WV | Stuffing (29%) | Stuffing, Turkey, Pumpkin Pie, Sweet Potatoes, Macaroni and Cheese, Mashed Potatoes |
| East South Central AL, KY, MS, TN | Stuffing (26.5%) | Stuffing, Turkey, Macaroni and Cheese, Mashed Potatoes, Sweet Potatoes, Cranberry Sauce |
| West South Central AK, LA, OK, TX | Turkey (37.7%) | Turkey, Stuffing, Sweet Potatoes, Pumpkin Pie, Green Bean Casserole |
| Mountain AZ, CO, ID, MT, NM, NV, UT, WY | Turkey (44.6%) | Turkey, Stuffing, Pumpkin Pie, Green Bean Casserole, Macaroni and Cheese, Sweet Potatoes |
| Pacific AK, CA, HI, OR, WA | Turkey (31.5%) | Turkey, Stuffing, Mashed Potatoes |
| National Winner | Turkey (35.4%) | Turkey, Stuffing, Pumpkin Pie, Mashed Potatoes, Sweet Potatoes |
Winner-take-all — where each district has only one winner — is the only paradigm most Americans have ever known. Even imagining alternatives is difficult. But when paired with an evocative metaphor, the unfamiliar mechanics of proportional representation become more accessible and even persuasive. And that’s without engaging in informational messaging that frames electoral system design as an urgent democracy issue — a connection that has proven to be an effective tool of persuasion in recent elections.
Implications for advocates
Proportional representation is gaining traction among reformers and opinion-makers, and in the media. But hyper-polarization and loud, extreme factions in our politics might be obscuring the fact that there’s room for broad public agreement on a better way of doing things — even if only a better way to hash out our differences. Americans are open to being persuaded in favor of proportional representation, they just need to be invited to engage.
Related Content
-
How to spot (and push back against) federal voter intimidation
- Building Pro-Democracy Collective Action
- Protecting Elections
- Research & Analysis
- Toolkit
-

Tracking retaliatory use of arrests, prosecutions, and investigations by the Trump administration
- Stopping the Consolidation of Power
- Research & Analysis
- Analysis
-

The dangers of military intervention in civilian law enforcement
- Stopping the Consolidation of Power
- Research & Analysis
- Reports
-

Safeguarding a nonpartisan civil service
- Building Pro-Democracy Collective Action
- Stopping the Consolidation of Power
- Research & Analysis
- Issue
Join Us.
Building a stronger, more resilient democracy is possible, but we can’t do it alone. Become part of the fight today.
Donate
Sign Up for Updates Sign Up for Updates
Explore Careers Explore Careers
How to Protect Democracy How to Protect Democracy